| Warm Pool expansion changes MJO and global rainfall patterns | ||

Roxy M. K., Panini Dasgupta, Michael J. McPhaden, Tamaki Suematsu, Chidong Zhang and Daehyun Kim, 2019, Twofold expansion of the Indo-Pacific warm pool warps the MJO lifecycle, Nature, 575, 647–651. doi: 10.1038/s41586-019-1764-4. | ||
| Western Ghats—The Wounded Hills | ||
| In a first-time documentary from The Hindu, we show how human actions—both at global and local levels—cause heavy rains, floods, and landslides, and are bringing the hills down. | ||
| Times of India highlights IPCC and IORP findings on sea level rise | ||
 Interview by Viashnavi Chandrashekhar in Times of India, regarding IPCC findings on sea level rise, and on IORP recommendations for addressing observational gaps. Interview by Viashnavi Chandrashekhar in Times of India, regarding IPCC findings on sea level rise, and on IORP recommendations for addressing observational gaps.Recent estimates—that is during the last decade—shows that the sea level rise along the Indian coast is about 3-6 cm per decade. That is about half a meter rise for 2000–2050 and a 1-meter rise for 2100. There are regions in Mumbai, and other cities (probably), which are already below or near sea level. They may not be bang on the coast, but without adequate protection, seawater inflow and extreme rains can submerge them for long periods. The impact is more when multiple extremes act together—these are called “compound events”. For example, when you have heavy rainfall events over increased sea level, the impact of floods would be much higher. This is applicable to cities like Kochi and Kolkata also. Remember the 2018 Kerala floods? The heavy rains happened along with a high tide, so the flood water did not flow out into the sea as fast as usual. The scenario with sea level rise is similar. | ||
| IPCC Special Report on Oceans and Cryosphere in a Changing Climate (SROCC) | ||
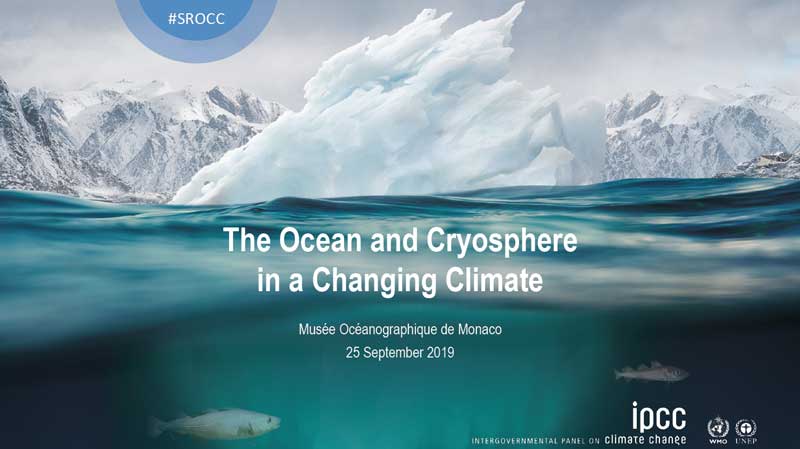 On 25th September 2019, the Intergovernmental Panel on Climate Change (IPCC) released a Special Report on Oceans and Cryosphere in a Changing Climate (SROCC). This new report will be the first to exclusively address the impacts of a warming world on the oceans, and cryosphere—the parts of the Earth that are covered by glaciers, sea ice, and permafrost. On 25th September 2019, the Intergovernmental Panel on Climate Change (IPCC) released a Special Report on Oceans and Cryosphere in a Changing Climate (SROCC). This new report will be the first to exclusively address the impacts of a warming world on the oceans, and cryosphere—the parts of the Earth that are covered by glaciers, sea ice, and permafrost.The report lists the emergence of ocean extremes in response to increasing carbon emissions due to the continued burning of fossil fuels—a manmade catastrophe. The extremes are oceanic counterparts to those on land and include Marine Heat Waves, Extreme El Niños, and Extremely Severe Cyclones. These ocean extremes are new to our world and have far-reaching impacts. I call them the monsters of the warming sea. Reference: Collins M., M. Sutherland, L. Bouwer, S.-M. Cheong, T. Frölicher, H. Jacot Des Combes, M. K. Roxy, I. Losada, K. McInnes, B. Ratter, E. Rivera-Arriga, R. D. Susanto, D. Swingedouw, L. Tibig, L., 2019, Extremes, Abrupt Changes and Managing Risks, in Portner et al., eds. IPCC Special Report on Oceans and Cryosphere in a Changing Climate. Cambridge University Press, Cambridge, United Kingdom and New York, NY, USA [pdf]. | ||
| IndOOS-2, the Indian Ocean Observing System | ||
 The Indian Ocean Observing System (IndOOS) is an observing network of profiling floats (Argo), a moored tropical array (RAMA), repeat lines of temperature profiles (XBT network), surface drifters (GDP), and tide gauges. Augmenting these networks are satellite remotely-sensed observations, in particular of surface winds, sea level, sea surface temperature, salinity, rainfall, and ocean color, as well as decadal surveys of a wide range of full-depth water properties (nutrients, CFCs, etc.) via the GO-SHIP program network, and emerging technologies like Saildrones. The Indian Ocean Observing System (IndOOS) is an observing network of profiling floats (Argo), a moored tropical array (RAMA), repeat lines of temperature profiles (XBT network), surface drifters (GDP), and tide gauges. Augmenting these networks are satellite remotely-sensed observations, in particular of surface winds, sea level, sea surface temperature, salinity, rainfall, and ocean color, as well as decadal surveys of a wide range of full-depth water properties (nutrients, CFCs, etc.) via the GO-SHIP program network, and emerging technologies like Saildrones.IndOOS is a key factor for the subseasonal to seasonal (MISO, MJO, Indian Ocean Dipole, Monsoon) forecasting and monitoring. The existing IndOOS design was established on the basis of an Implementation Plan drafted by the Indian Ocean Region Panel in 2006. Since then, societal and scientific priorities have changed, and measurement technologies have evolved, many practicalities of implementation have been learned, and the pace of climatic and oceanic change has accelerated. Keeping this in mind, we have reviewed the IndOOS network and present a new plan for the Indian Ocean. This has been done through three international workshops, sixty authors, and an expert review panel of six, and sponsored by WCRP, IO-GOOS, IOC-UNESCO, US NOAA, and IUGG. Pertaining to this review, we have recently published three review articles on the IndOOS. 1. Executive Summary. IndOOS-2: A roadmap to sustained observations of the Indian Ocean for 2020-2030 by Beal, L. M., J. Vialard, M. K. Roxy and lead authors, CLIVAR Report-4/2019, GOOS-237, I-VIII pp. doi: 10.36071/clivar.rp.4-1.2019 [pdf] 2. A sustained ocean observing system in the Indian Ocean for climate related scientific knowledge and societal needs by Hermes J. C., Y. Masumoto, L. M. Beal, M. K. Roxy, J. Vialard and co-authors in Frontiers in Marine Science, 2019, 6:355, doi: 10.3389/fmars.2019.00355 [pdf]. 3. Ocean climate observing requirements in support of Climate Research and Climate Information by Stammer D., A. Bracco, K. AchutaRao, L. Beal, M. K. Roxy and co-authors in Frontiers in Marine Science, 2019, 6:444, doi: 10.3389/fmars.2019.00444 [pdf]. | ||
| Science Communication to First Graders in Washington, May 2019 | ||
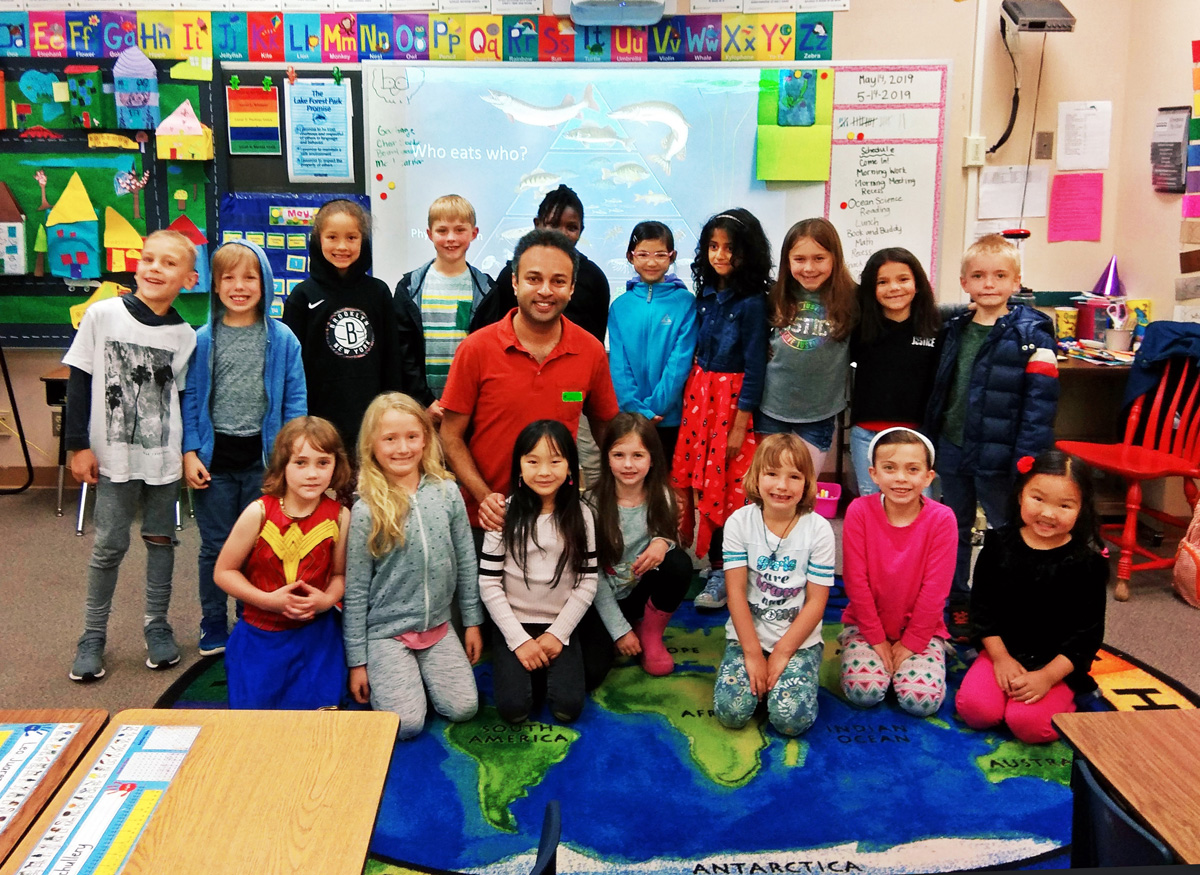 I had my happiest moment as a teacher today, talking about oceans and climate change and phytoplankton to First Grade kids at Lake Forest Park Elementary school in Washington. The kids were super-interactive and we had fun time! They are concerned about the oceans and the air we breathe and the air we feel. Some of them have already heard about phytoplankton, but don’t know what a politician is 🙂 I had my happiest moment as a teacher today, talking about oceans and climate change and phytoplankton to First Grade kids at Lake Forest Park Elementary school in Washington. The kids were super-interactive and we had fun time! They are concerned about the oceans and the air we breathe and the air we feel. Some of them have already heard about phytoplankton, but don’t know what a politician is 🙂 | ||
| Shreyas wins the Best Poster Award at the MAPEX Workshop, IIT-Delhi, Mar 2019 | ||
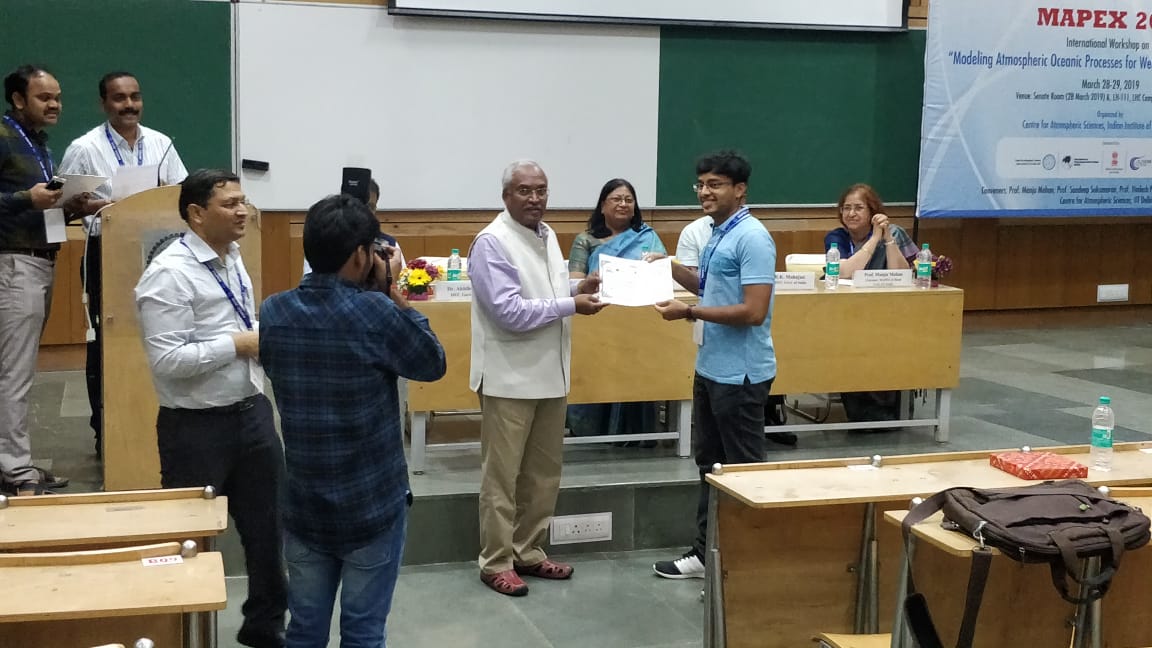 Congrats to Shreyas Dhavale – from our Climate Lab team for the best poster award at the MAPEX Workshop at IT-Delhi. The study looked into the interactions between tropical cyclone and the monsoon. Congrats to Shreyas Dhavale – from our Climate Lab team for the best poster award at the MAPEX Workshop at IT-Delhi. The study looked into the interactions between tropical cyclone and the monsoon. | ||
| IndOOS Review Final Workshop and Indian Ocean Region Panel meetings at Port Elizabeth, South Africa, Mar 2019 | ||
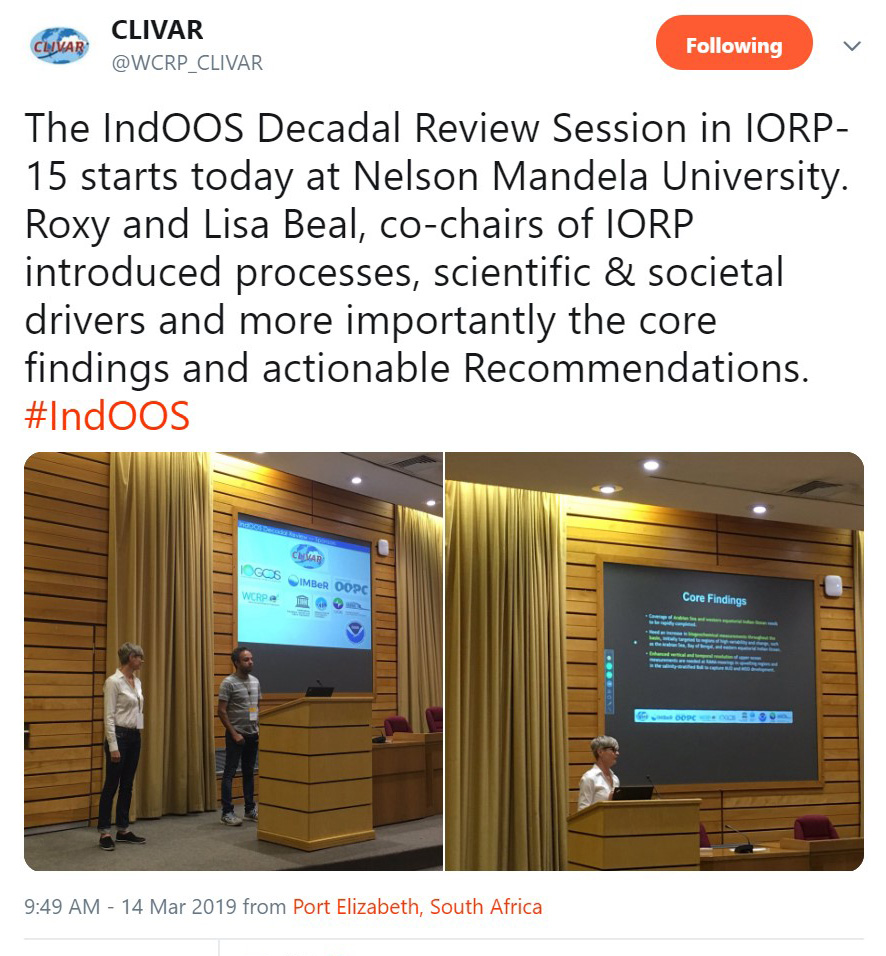 The final session on the Indian Ocean Observation System (IndOOS) Decadal Review was held at Port Elizabeth, South Africa, during 11-15 March 2019. Roxy Mathew Koll and Lisa Beal, co-chairs of the Indian Ocean Region Panel (IORP) introduced the scientific and societal drivers and more importantly the core findings and actionable recommendations for a revised IndOOS. The review was held along with the IIOE-2/SIBER/IOGOOS meetings and the 15th Annual Meeting of the IOPR. The final session on the Indian Ocean Observation System (IndOOS) Decadal Review was held at Port Elizabeth, South Africa, during 11-15 March 2019. Roxy Mathew Koll and Lisa Beal, co-chairs of the Indian Ocean Region Panel (IORP) introduced the scientific and societal drivers and more importantly the core findings and actionable recommendations for a revised IndOOS. The review was held along with the IIOE-2/SIBER/IOGOOS meetings and the 15th Annual Meeting of the IOPR. | ||
| IPCC SROCC Fourth Lead Author Meeting at Kazan, Russia, Mar 2019 | ||
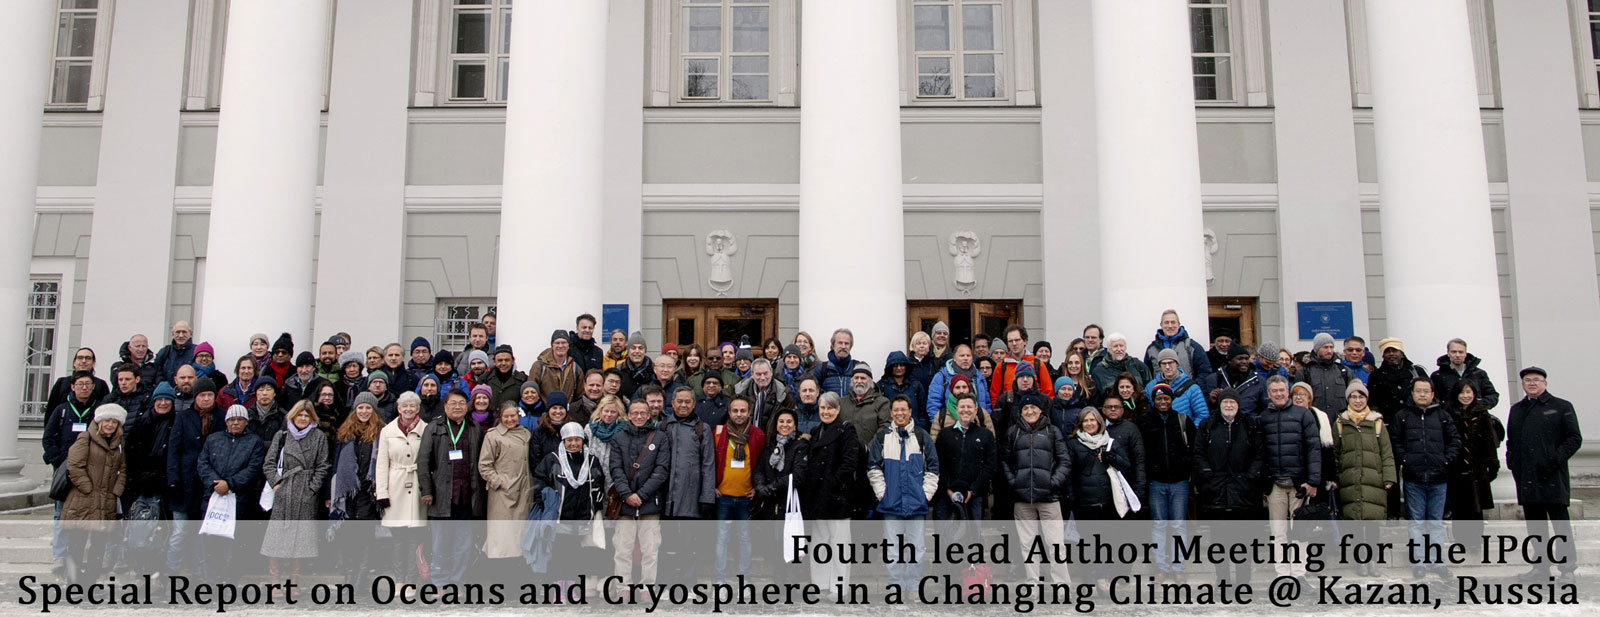 The IPCC authors met at Kazan in Russia to prepare the Final Draft of the Special Report on Ocean and Cryosphere in a Changing Climate (SROCC). Roxy Mathew Koll is dealing with the chapter on extremes and abrupt changes in the ocean, and managing the risks. The IPCC authors met at Kazan in Russia to prepare the Final Draft of the Special Report on Ocean and Cryosphere in a Changing Climate (SROCC). Roxy Mathew Koll is dealing with the chapter on extremes and abrupt changes in the ocean, and managing the risks. | ||
| Review on the impacts of anthropogenic climate change on the monsoon | ||
| We have recently published two review papers on the impacts of anthropogenic climate change on the Indian summer monsoon. 1. Indian summer monsoon: Extreme events, historical changes, and role of anthropogenic forcings by D. Singh, S. Ghosh, M. K. Roxy and S. McDermid in WIREs Clim Change, 2019, 10:e571, doi:10.1002/wcc.571 [pdf]. 2. Impacts of Climate Change on the Indian Summer Monsoon by M. K. Roxy and S. T. Chaithra in Climate Change and Water Resources in India, edited by Vimal Mishra, and J. R. Bhatt, Ministry of Environment Forest and Climate Change, 2019, 21-37, ISBN: 978-81-933131-6-9 [pdf].
| ||
| Science communication @ school | ||
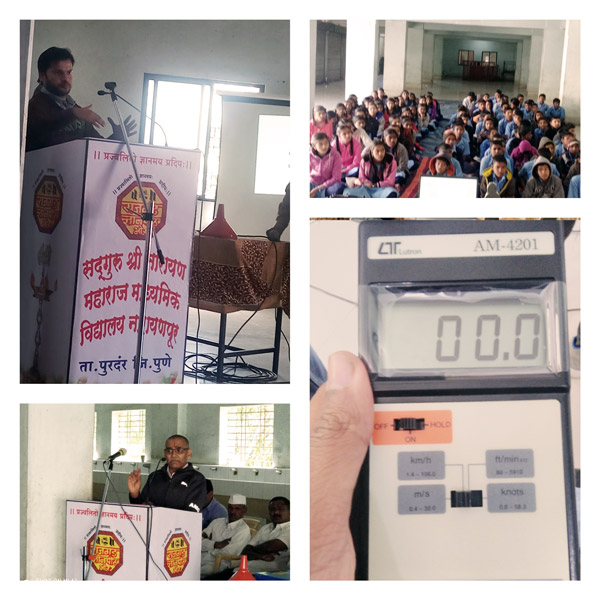 Vineet, Dr. Milind Mujumdar and team visited the Narayan Maharaj Madhyamik School at Narayanpur and introduced the students to the basics of weather and climate. The team from IITM gifted a digital thermometer to the school. Vineet, Dr. Milind Mujumdar and team visited the Narayan Maharaj Madhyamik School at Narayanpur and introduced the students to the basics of weather and climate. The team from IITM gifted a digital thermometer to the school.The digital thermometer has the facility to record indoor and outdoor daily maximum minimum temperature and relative humidity. The students will daily readings and send those readings to IITM. This will be a useful record since the location doesn’t have any weather stations nearby. The team is also planning to install a rain gauge at the school location before this monsoon. | ||
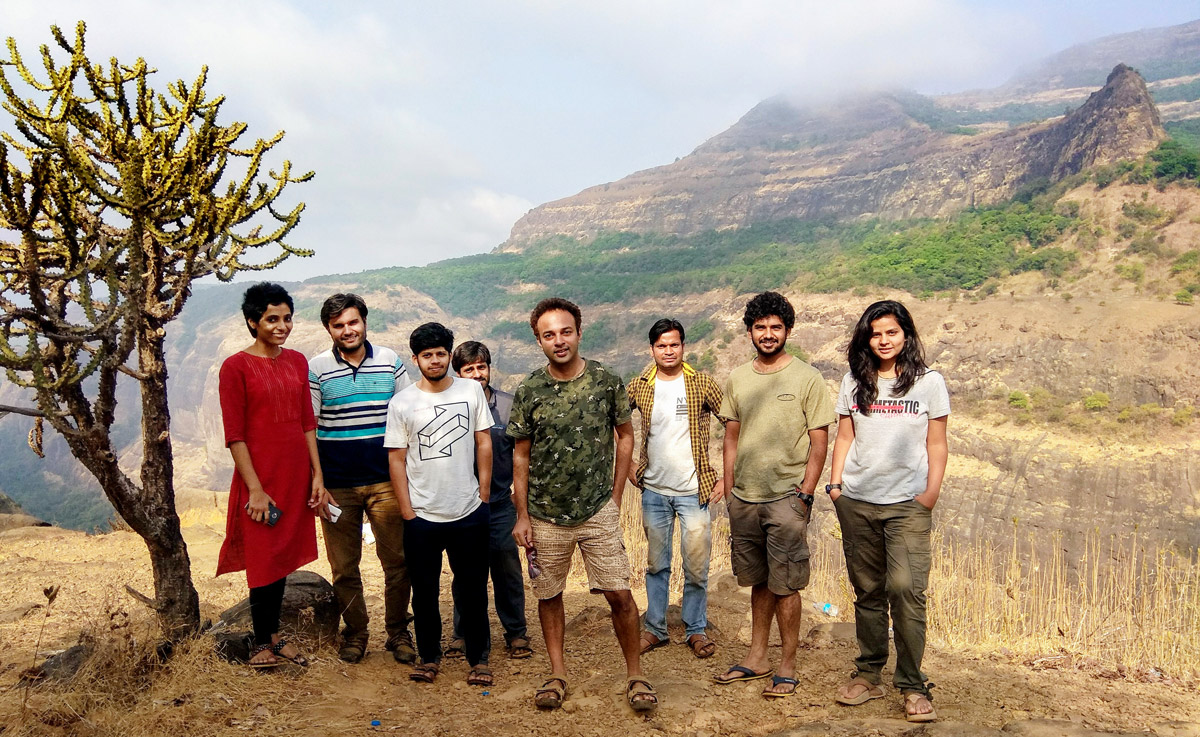
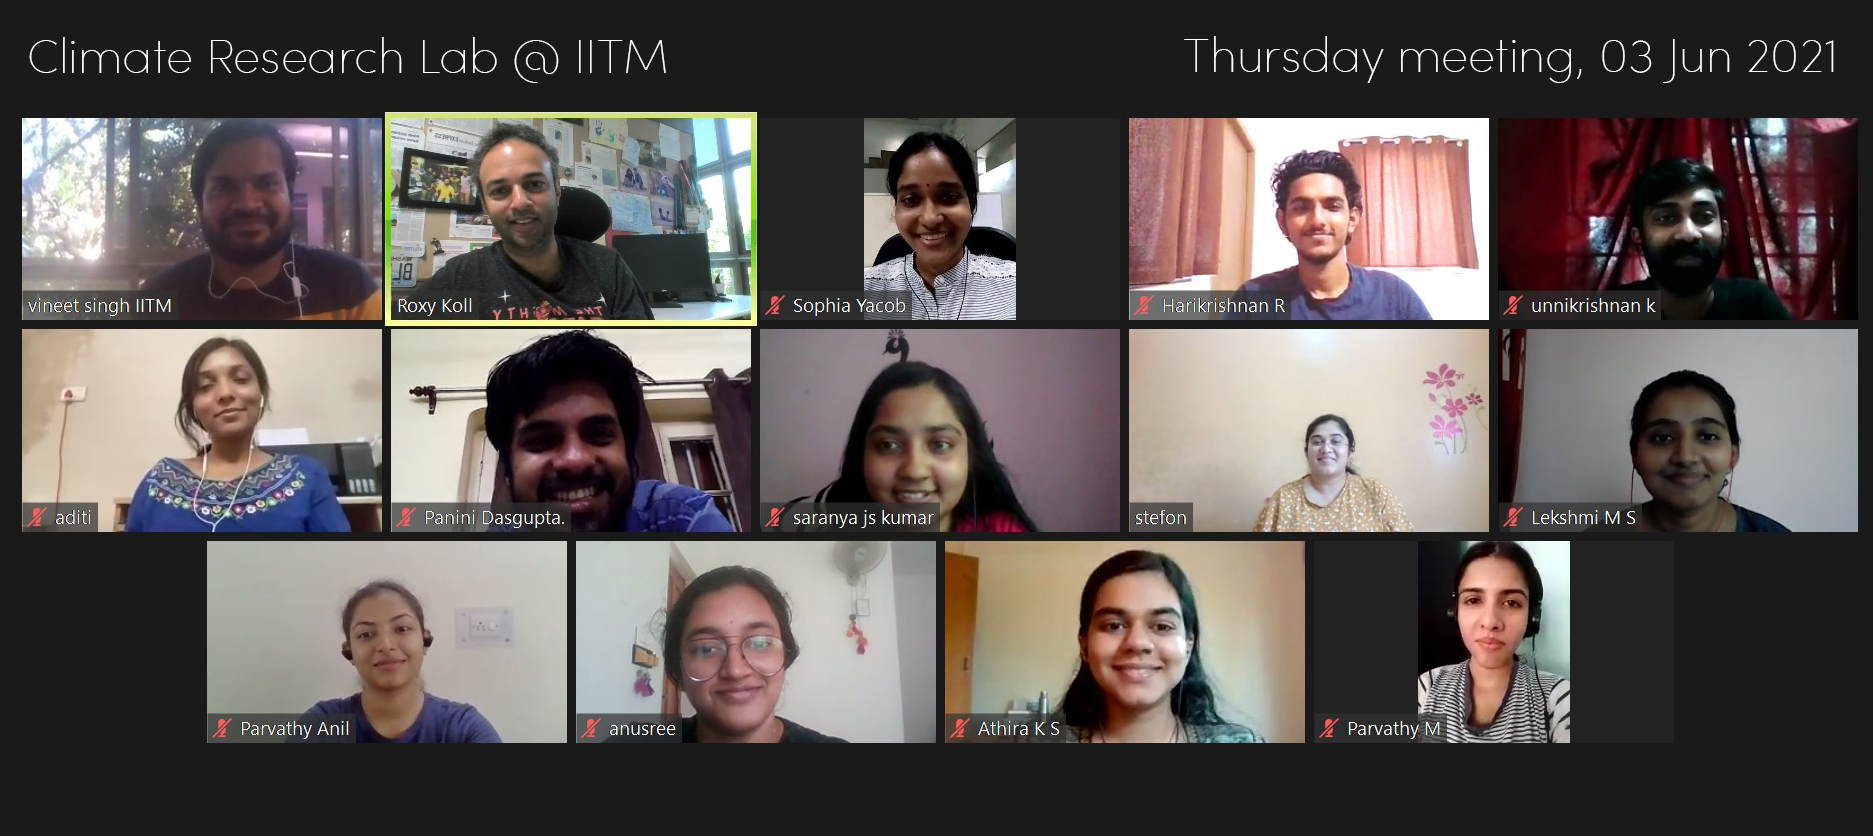
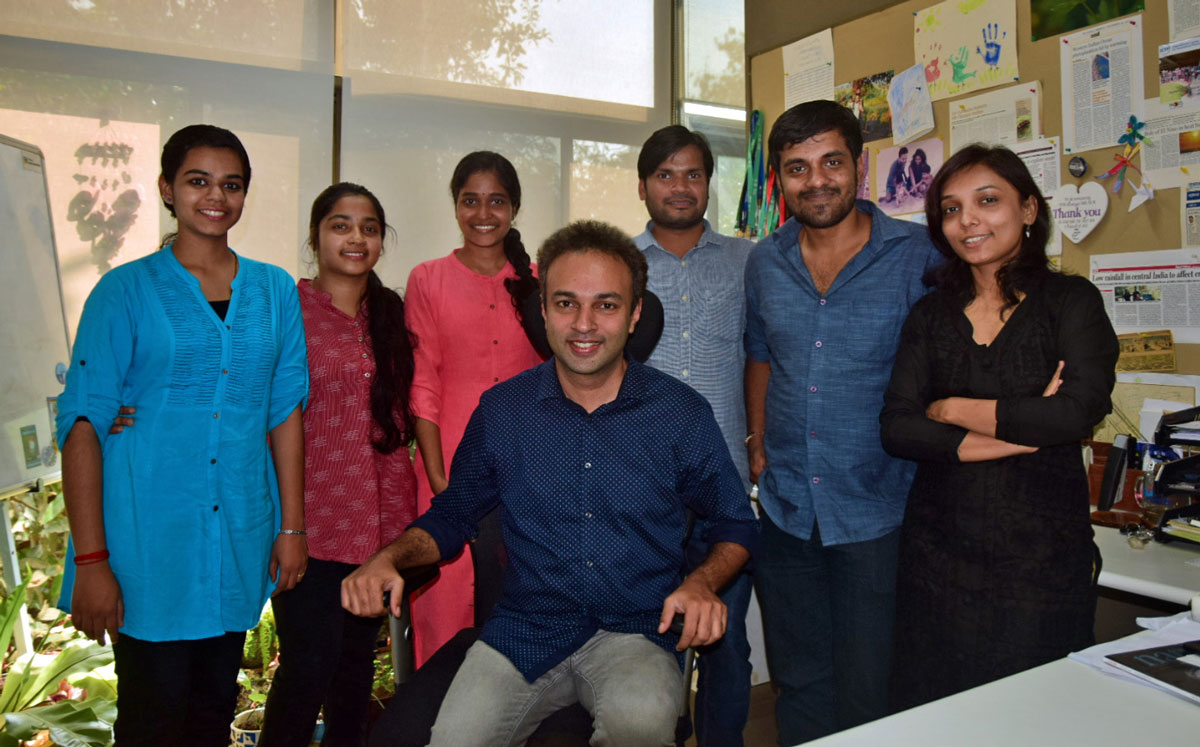
| Climate Research Lab, 2018-2019 | ||
 |